Project Profitability Software for African Construction Contractors
Compare contract revenue against direct costs, overhead allocations, and subcontractor payments — project by project — to know exactly which jobs make money across your operations.
What is Project Profitability & Reporting?
Most construction companies in Africa know their bank balance but not their margin. They know a project cost KES 38M to deliver, but cannot easily tell you whether it was profitable — because the revenue recognition, overhead allocation, and cost categorisation that would answer that question live in different spreadsheets, different people's heads, and the accountant's year-end workbook. InfraPro's Project Profitability module puts live margin data in the hands of project managers and executives without waiting for month-end close.
The module starts with the contract: the agreed contract value with the client, any approved variations, and the expected margin at contract stage. As the project runs, every approved expense, payroll allocation, material issuance, and subcontractor payment is recorded against the project. The profitability dashboard updates in real time — showing contract value, total costs to date, estimated costs to complete, projected margin, and a comparison to the original bid margin. When a project's projected margin falls below the target threshold, the system alerts the project manager and finance director automatically.
Overhead allocation is one of the most underestimated profit killers in construction. Head office staff costs, vehicle running costs, and administrative overheads are real costs that must be recovered from project margins — but in most companies, they are either ignored at project level or allocated by guesswork. InfraPro's overhead allocation engine distributes indirect costs to projects based on configurable rules (revenue %, labour hours, or direct cost %) giving a genuinely accurate picture of each project's net contribution to the business.
- Contract value vs actual cost tracking
- Gross & net margin per project
- Phase-level cost breakdown
- Overhead allocation per project
- Profitability dashboard across portfolio
See Project Profitability & Reporting Live
Book a personalised demo and see exactly how Project Profitability & Reporting works in a real InfraPro environment.
Book a Free DemoTalk to Sales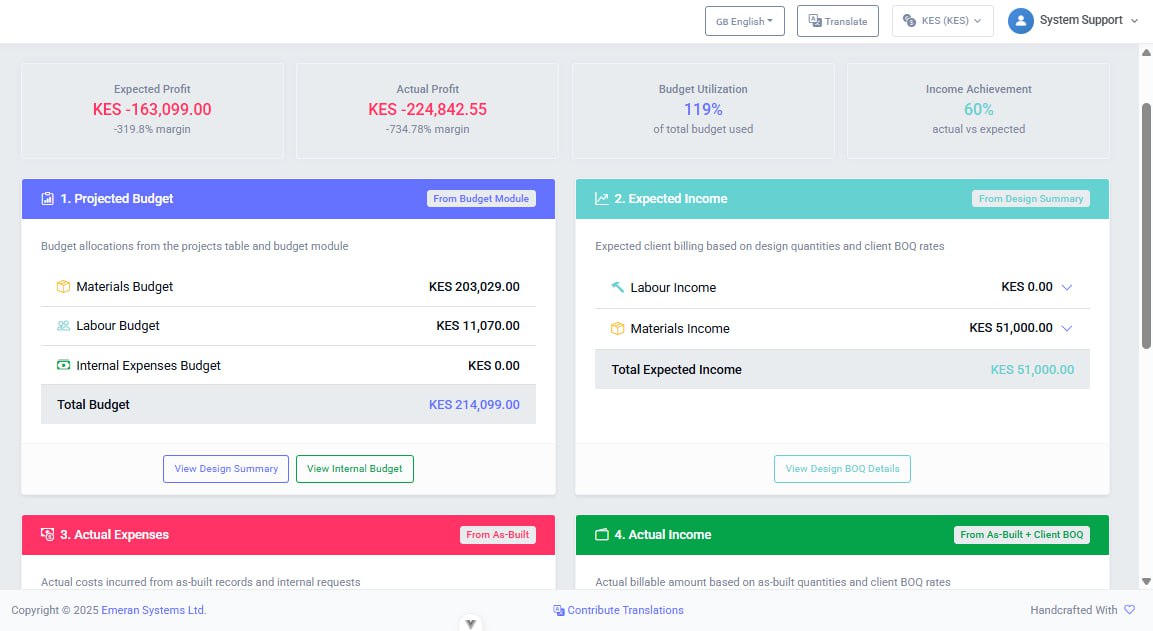
Everything Included in Project Profitability & Reporting
Contract Value & Variation Tracking
Record contract value, approved variations, and provisional sum utilisation. Track the evolving contract position as variations are approved or disputed.
Real-Time Margin Dashboard
Live profitability view per project showing contract value, costs to date, estimated cost to complete, projected margin (%), and variance to bid margin.
Cost Category Breakdown
Drill into project costs by category: labour, materials, plant, subcontractors, overhead — see exactly where margin is being consumed and where assumptions were wrong.
Phase-Level Profitability
Where projects are broken into phases or sub-projects, see profitability at phase level. Identify which phases are profitable and which are eroding the overall margin.
Overhead Allocation Engine
Distribute head office overheads to projects based on configurable drivers: revenue percentage, direct labour hours, or direct cost percentage. Produce fully loaded project P&L statements.
Subcontractor Margin Analysis
Compare subcontractor contract rates to actual payments. Identify variation claims, retention deductions, and back-charge exposures that affect the project's net margin.
Budget vs Outturn Comparison
Compare the original budget, revised budget, and actual outturn costs at project close. Build a historical database of cost performance to improve future estimating.
Portfolio Profitability View
Executives see all active projects ranked by margin percentage and absolute profit — instantly identifying the most and least profitable work in the current portfolio.
Profitability Alerts
Configurable alerts when a project's projected margin falls below defined thresholds (e.g., 10%, 5%, 0%). Early warning gives time to take corrective action before losses crystallise.
Client & Sector Analytics
Analyse profitability by client, by project type, and by country — identifying which clients, markets, and contract types generate the best returns for the business.
Why Teams Choose This Module
Stop Bidding Unprofitable Work
Historical margin data by project type and client reveals which contracts consistently erode margin — so future bids are based on reality, not optimism.
Catch Margin Erosion Early
When a project's projected margin drops, you know within days — not at year-end when the damage is done. Early alerts mean corrective action is still possible.
Accurate Overhead Recovery
Stop subsidising projects with unallocated head office costs. Proper overhead allocation means every project shows its true contribution to the business.
Board-Ready Financial Reporting
Executive profitability dashboards and portfolio P&L reports give boards and investors the financial visibility they need — without waiting for the accounts to be finalised.
How Different Industries Use This
Track KPLC and REREC contract profitability through the full project lifecycle — from bid margin to final outturn — identifying which scheme sizes and geographies deliver the best returns.
Compare profitability across ISP rollout contracts, ISP maintenance contracts, and build-operate-transfer projects — identifying the commercial models that deliver sustainable margins.
Common Questions About Project Profitability & Reporting
Explore Other Modules
Full project lifecycle — from kickoff to handover
Budget & Expense Management4-layer budget control — project, internal, material, construction
Live Progress TrackingKnow exactly where every project stands — right now
Material & BOQ ManagementFrom purchase order to as-built — every item accounted for
Ready to See Project Profitability & Reporting in Action?
Book a free demo — we'll show you this exact module configured for your project type.
Book a Free Demo →